Nifty Index price trend prediction 
I had tried to predict the price trend of the Indian Nifty Index even though I do not know anything about the Indian stock market. I have never tracked the price movement or the news on Indian Nifty Index. I do not know much about the Indian economy or the Indian stock exchange. I do not know who are the main players in the market or whether the Inidan stock market is driven by the retail investor or the fund managers. So this Nifty Index price trend prediction was done blind – purely based upon historical prices. This prediction was done on 12th October 2012 with earlier data. You will notice that I tried to predict the Nifty Index price trend from about January 2012 to about May 2014.
Some explanation of my Indian Nifty Index prediction chart
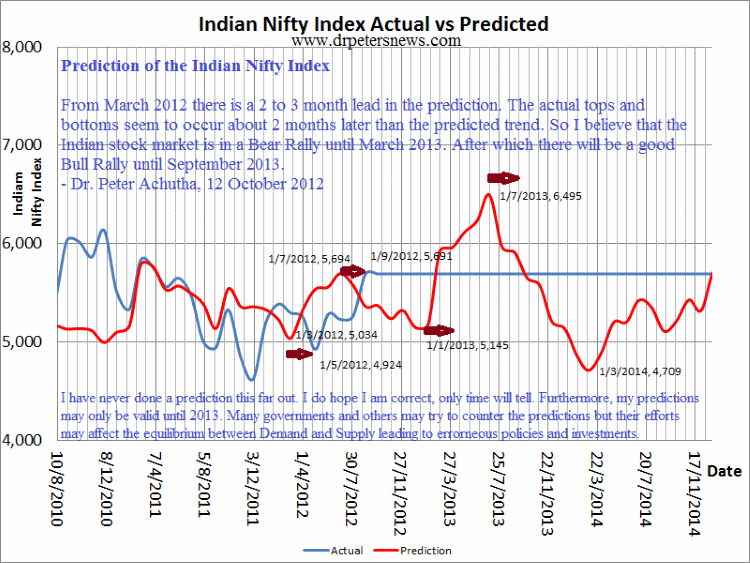
I do need to inform you that my prediction charts were created using once a month closing price. That is I took the last closing price for a month to represent that month. This is sufficient pricing information to project price trends many months or many years into the future. I was able to overlap the actual Nifty Index trend and the predicted Nifty Index trend onto one chart.
Indian Nifty Index predicted trend vs actual trend
Explanation of the Indian Nifty Index trend stock chart
You will notice that the 'historical prediction' from January 2011 to July / September 2012 is very close but there is a two months offset or lead or shift to the right. That is the predicted trend occurs about two months earlier then the actual trend. This prediction chart is not in my book “Market Theories and Predicting the Stock Market by Visual Inspection” as this chart was done in order to explain to one of my book buyers how to use my theory to predict the Indian Nifty Index. I do not given any advice on stock markets and only explain how to use my theories to predict stocks and commodities.
Before I predicted how the Indian Nifty Index would move I had given predictions of rapeseed and soybean. After September 2012, I do expect a Bear rally in the Indian Nifty Index until March 2013. The predicted trend for the Indian Nifty Index shows January 2013 but as it occurs earlier I do expect the end of the Bear rally to occur by March 2013. After the Bear rally, I do expect the Bull rally to push the Indian Nifty Index up until September 2013. My predicted trend shows July 2013 but as this predicted trends occurs 2 months earlier I do expect the actual Nifty Index trend to peak by September 2013.
My prediction techniques
I am not one for predicting actual prices for a certain date but more for predicting the shape of the price trend curve. It appears that when you apply all of my theory, your predicted price can closely reflect the actual price.
Uses of price trend prediction charts
If you were a day trader you could have taken advantage of any of the Bull and Bear rallies on the Indian Nifty Index since January 2011? I am publishing my charts on my website to show how my price trend predictions turned out. And I do hope these charts show that commodities and stocks are predictable to some degree provided that governments and major players do not try to negate the predictions. When they do try to negate or counter the predictions they may destabilise the equilibrium in Demand and Supply which will show up later. I will explain more of this in my other commodity charts. The most important thing about these charts is the general or overall trend which can be used to guide your day trading activity, costing and production planning and other financial activities years in advance.
I do hope the chart is correct as I have never predicted this far out.
This article Indian stock exchange nifty index prediction chart was researched and written on 13th October 2012 by Peter Achutha
Please do show me your appreciation of this article by Buying me a coffee.
And do get the "I Won" t-shirt
|