Mr. Achutha A/L Dr. Marimuttu Balasundram
XX, Jalan XX/XX,
XXXXX Petaling Jaya,
Selangor D.E.
Tel: 03 - XXX XXXX
Dear Datuk Seri Dr. Mahathir,
As promised, nine months ago, here is the updated predictions for the KLSE Composite Index predictions. The predictions are based upon a combination of the older and newer technologies - finally merged the two technologies. Basically, the differences, without revealing the actual equations, are as follows:-
The older technologies mathematically described the share price movement as follows:-
s(t) = f(t)*g(t) ...eqn. (1)
where s(t) is share price movement with respect to time
f(t) & g(t) are underlying historical price trend equations.
incorporation of the newer technologies modifies the share price prediction equation to :-
p(t) = h(t)*f(t)*g(t) .. eqn.(2)
where p(t) is the predicted share price trend and
h(t) is a modifier that takes into account current
share price behaviour and modifies the historical price trend response.
What is the difference between the two? Both provide respectable price trend forecast under stabilised market conditions. Equation (1), s(t), provides an underling behaviour as a market systems response. Hence, the predicted values cannot be altered or compensated for during the period for which the prediction was given. Equation (2), p(t), provides a compensated value based upon current market forces and in fact provides price trend forecasts for various degrees of market interest. Market interest meaning lot more buyers moving into the market, foreign fund managers coming in, extra liquidity, improvements in the economy, better investor confidence levels ..etc. That is there are two fundamental influences to the stock market movement, they are the market systems response and investor interest / confidence.
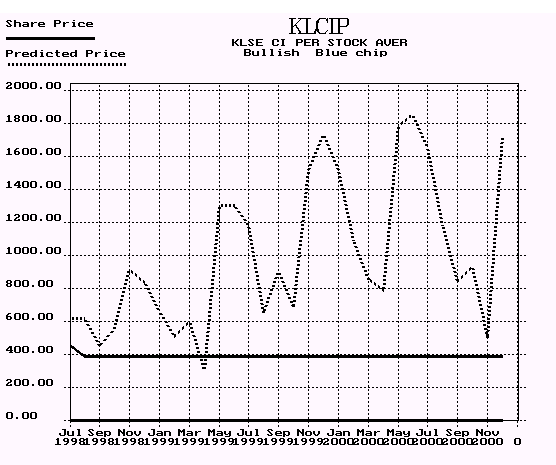
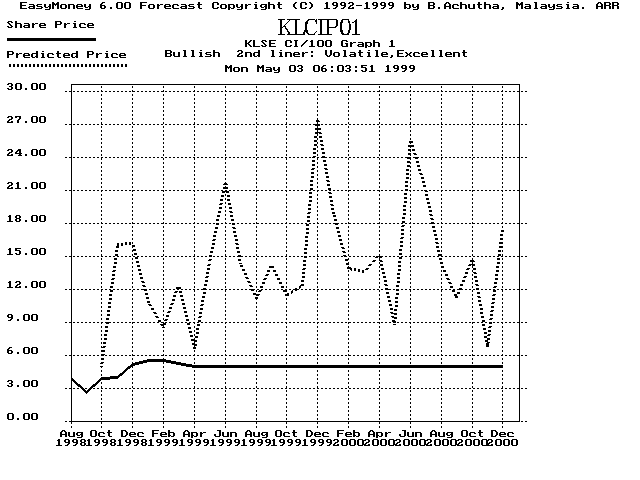
The graphs below show how the market would respond with increasing market interest. The first graph below was the original given in August 1998. The second graph below, Graph 1, shows the effect of the combined technologies upon predictions with minimal impact of market interest h(t).
The first predicted peak was for November 1998, when market interest was factored in this predicted peak shifted to December 1998. In reality the first peak occurred in January 1999. This shifting of the peaks indicates a renewed market interest / confidence in the economy rather then from a market systems response.
Both indicate that the CI begins climbing again in April 1999 but when some minimal market interest is factored the climb carries on until June 1999. Both predict a third climb occurring around late Q3 or early Q4. (I expect error tolerances in the graphs to be around +/- 1 month.)
Lets us look at the predictions if we should factor in additional market interest / confidence.
(Graphs 1 and 2 have been rescaled to lower values.)
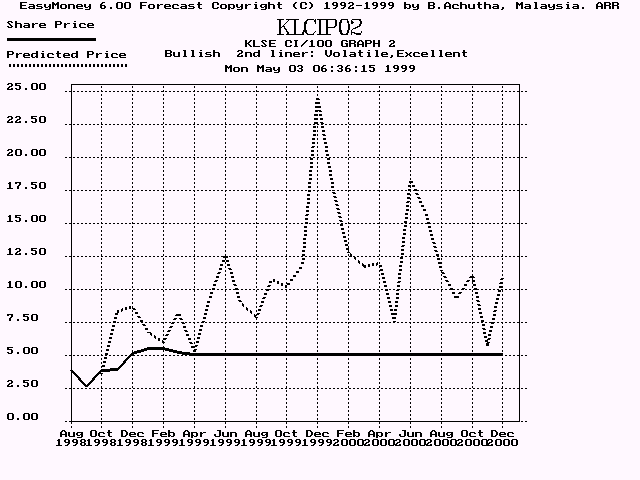
The August 1998 prediction and Graph 1, both indicate it will be around October 1999 when the next climb occurs. But with improved market interest, as indicated in Graph 2, this climb can begin as early as August 1999. With more market interest the June to August down turn will almost disappear but I don't think we will see one extended run from April to December 1999. The other difficulty I'm having is in deciding whether the market peak will be Dec 1999 or later around Q2/Q3 2000, as I believe we are in a formative period of the new 10 to 15 years of bull runs hence there is insufficient data to confirm this.
The difficulty in predicting the exact shape of the Composite Index is that, firstly, it is a Composite Index, secondly I need to increase the size of my database and thirdly, I believe, not proven yet, that this period is a formative period for the next 10 to 15 years of bull runs. Let me explain. What we are looking at is what economist call the bubble economy - this is a terrible term that really does not explain what happens. America and Japan have both experienced bubble economy type crashes, so its nothing to do with how a country's economy is managed or whether its a developed or underdeveloped economy. (Anyway the Americans cannot explain why they had the crash of, if I remember correctly, Oct '87 - they blamed it on majority of their computers issuing sell orders simultaneously )
I used Probability Theory to derive the equations for demand and supply curves (I can't figure out where I hid the paperwork, but it'll take two or three days to re-derive the equations) and consumer market model. Basically, what it indicates is that a substantial percentage of consumers will move out of the market when the price of product increases beyond a certain amount - shrinking market. (Exactly what price this occurs at, depends on the elasticity of the demand & supply curves for the product - this being textbook economics.)
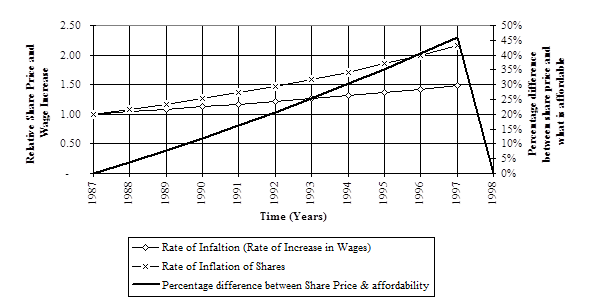
When we do look at the stock market behaviour, the KLSE CI had an inflationary rate of 8% but CPI (and wage increases) was at 4% for a very long time. Looking at the graph below, over period of 8 to 11 years (I projected from 1987 not earlier, but not with actual data and assumed linear or constant values for ease of explanation) the "bottomed price" of shares had increased to about 30% to 50% higher then what was affordable, simply because wages or incomes hadn't kept up with the faster climb in prices hence a major crash in the making. The same scenario occurred to property prices. This resulted in consumer market shrinking because products were not affordable. Hence the deflationary, price dropping, trend as indicated by the bottom to bottom levels of the KLSE CI. Rekindling consumer purchasing or consumer confidence was by lowering prices of properties and products and services. This brings back consumer activity.
I think the terms bubble economy and bubble bursting don't really describe this phenomena of a consumer or market driven economy. So, if this gap between what people can afford and what they have to pay increases substantially a major market crash - no buyers, will occur (the bubble bursts). But it does not happen that frequently, about every 10 to 15 years.
Hence, if wage and price increases are similar to previous rates then we will have a 'cyclical type' phenomena of growth followed by a major crash every decade or decade and a half. During this period immediately after the crash, the historical data is of a very much larger value then the actual current share price values, hence the predictions tend to have very large values too. Once the recovery period is behind us, we will have historical data whose magnitude is closer to the current market trends. Subsequent bull runs trend predictions should be more realistic.
Thanks and best regards,
.....
Achu
an engineer
P.S.
Dear Sir,
I'm having great difficulty finding venture capital or investors as I'm stuck in a chicken or egg situation. If you could please help, is there anyone or any organisation/company whom I could contact to help me.
Thanks,
This article on the 8th letter to PM was reproduced here by Dr. Peter Achutha - 24 December 2017.